A number of traders have a problem defining what momentum is, zlines (s/d) actually are and how to use them as a bias.
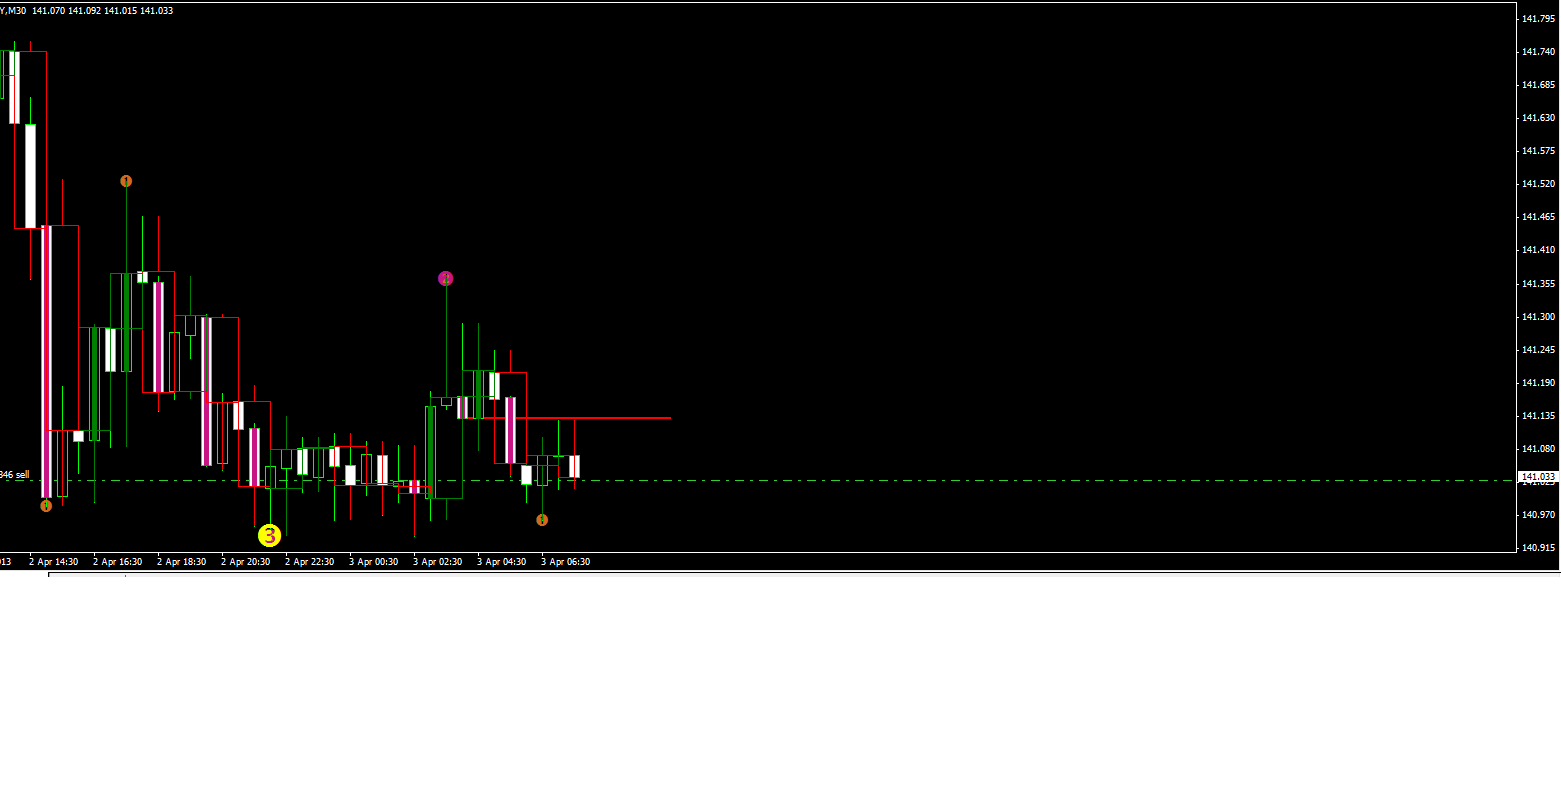
Just a little inquiry. How many zlines would you draw on this chart?
Post it, I would like to see how many different variations we get.
Thanks!
dojirock
A fresh start! Doji's Trading Journal
Moderator: moderators
Please add www.kreslik.com to your ad blocker white list.
Thank you for your support.
Thank you for your support.
-
LegendofZline
- rank: 150+ posts

- Posts: 200
- Joined: Tue Jan 15, 2013 2:43 am
- Reputation: 60
- Gender:

-
LegendofZline
- rank: 150+ posts
- Posts: 200
- Joined: Tue Jan 15, 2013 2:43 am
- Reputation: 60
- Gender:
dojirock wrote:A number of traders have a problem defining what momentum is, zlines (s/d) actually are and how to use them as a bias.
Just a little inquiry. How many zlines would you draw on this chart?
Post it, I would like to see how many different variations we get.
Thanks!
dojirock
What do you think? Fail or Pass

Hi Legend,
Not to usurp Doji's thread and its contents, however; I look for 'momentum' candles.
'Momentum' aka larger candles - relative to the other candles in an area indicate 2 things:
1. Crossing of a S/R line - becoming new S or R
And
2. Stopping at S/R line.
Its very strange how S/R levels correlate with 'momo' candles. Often you will find 'momo' at the beginning of S/R.
** Currently, as I'm spending upwards of 10 hours a day looking at some kind of candlestick chart - my mind is able, I believe, to identify clusters of supply and demand areas automatically. S D areas appear at key S/R lines.
From there, I just look for 'momo' away from that line/cluster - and trade in that direction.
Hope this helps.
-
newscalper

- rank: 1000+ posts

- Posts: 1068
- Joined: Tue Oct 19, 2010 5:58 pm
- Reputation: 7
- Gender:

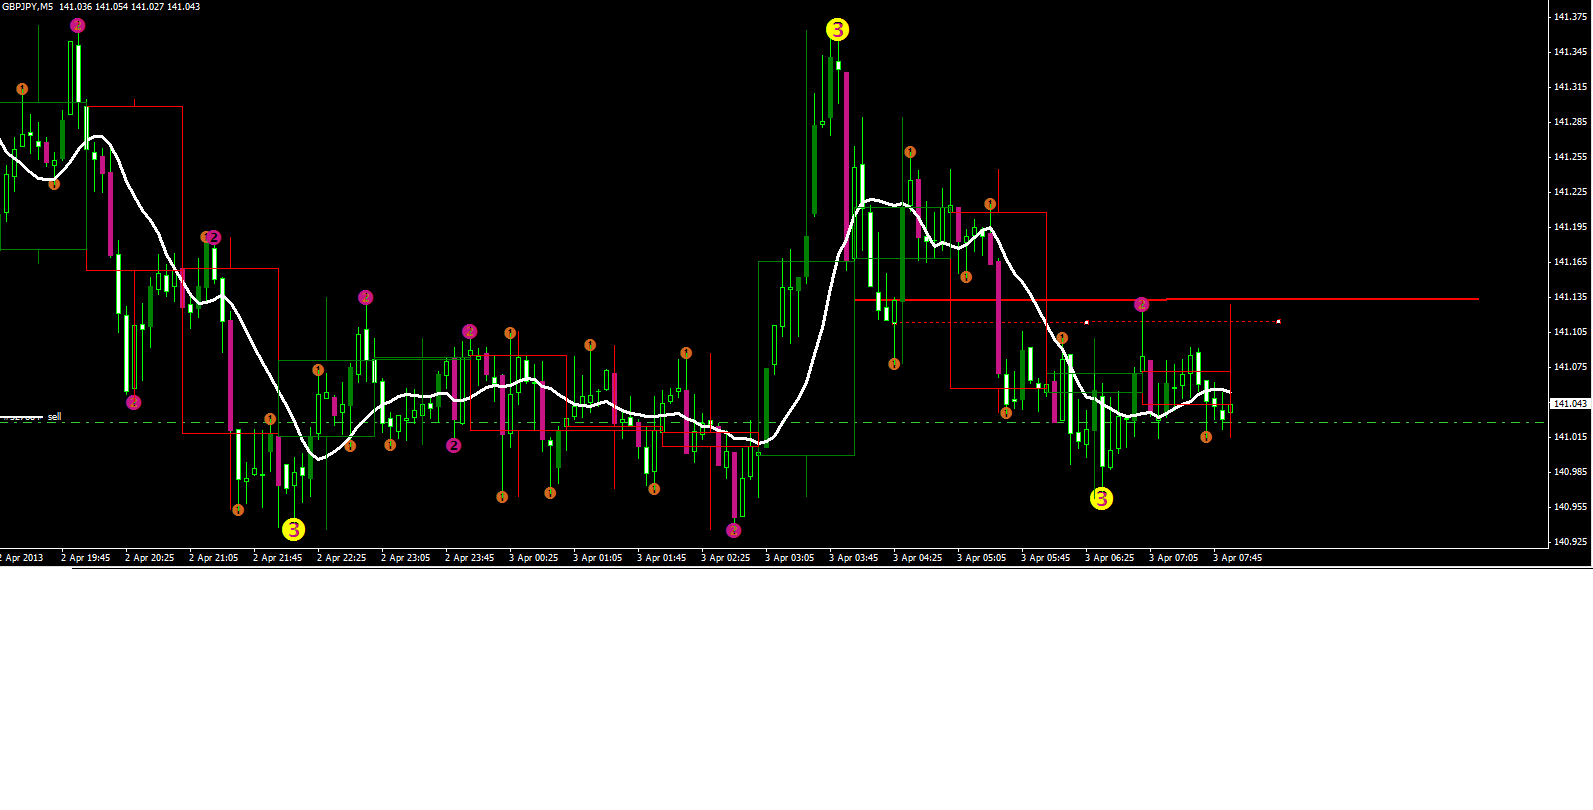
I'll bite
I wasn't considering if'/when the bars broke as another poster has, I've drawn the lines as they would have been. I assume these are lines to trade on the M5 as it's usual to trade lines from a higher TF tha nthe one you're looking at otherwise you won't get the range/r:r/whatever. If the answer is to be the only ones of interest are where the semas are...consider the semas were not where they are now at point of drawing the line.
I wasn't considering if'/when the bars broke as another poster has, I've drawn the lines as they would have been. I assume these are lines to trade on the M5 as it's usual to trade lines from a higher TF tha nthe one you're looking at otherwise you won't get the range/r:r/whatever. If the answer is to be the only ones of interest are where the semas are...consider the semas were not where they are now at point of drawing the line.
Please add www.kreslik.com to your ad blocker white list.
Thank you for your support.
Thank you for your support.
-
trueblueTEX

- rank: 500+ posts

- Posts: 532
- Joined: Mon Apr 12, 2010 4:38 pm
- Reputation: 2
- Gender:
Well, I have been following this for some time now. I don't recall 'bias' being talked about so much here so I guess I have missed something.
I suppose that my meager contribution to doji's contest will demonstrate I have a lot o' learnin' left to do
Here, I offer up my finger painting to the Rembrants:
I suppose that my meager contribution to doji's contest will demonstrate I have a lot o' learnin' left to do
Here, I offer up my finger painting to the Rembrants:
-
dojirock

- rank: 1000+ posts
- Posts: 1921
- Joined: Tue Nov 17, 2009 10:11 pm
- Reputation: 726
- Gender:
- Contact:
Unless that is a very quick scalp, its dangerous trading int ot the hourly zline there going short. I would have put my stop there and been long. But I realize we all trade different time frames.
LegendofZline wrote:I will do this challenge. But first what you think
First found bias
Lower tf find entry when above ema
Thanks for any input
It always takes Momentum to break Momentum!
"A small loss is just as satisfying as a large gain" -MO
"Sometimes we need to stop learning and start thinking...."
"Once you stack, you'll never go back!"
"A small loss is just as satisfying as a large gain" -MO
"Sometimes we need to stop learning and start thinking...."
"Once you stack, you'll never go back!"
-
dojirock
- rank: 1000+ posts
- Posts: 1921
- Joined: Tue Nov 17, 2009 10:11 pm
- Reputation: 726
- Gender:
- Contact:
Hi Legend,
Its not a matter of pass or fail due to we all see price action differently. My reason for asking this and doing this exercise was to see how many are close to what I do and to see, and if some are over thinking the whole process. I can draw lines all day long but if you guys don't understand why I drew them or why you draw yours for that matter, maybe its all for null.
Let me start by saying, your lines are the closest to what I have drawn. If you look in the upper corner there is a "11" which was the max lines I could possibly draw due to how i see them and would draw them. I say max because there is an area in the center that really is just consolidating so two of those lines could have been eliminated. I put that 11 up there , kind of hidden so you guys wouldn't think I was making all this crap up. I still get those idiots that are not believers. lol
Nice chart!
LegendofZline wrote:dojirock wrote:A number of traders have a problem defining what momentum is, zlines (s/d) actually are and how to use them as a bias.
Just a little inquiry. How many zlines would you draw on this chart?
Post it, I would like to see how many different variations we get.
Thanks!
dojirock
What do you think? Fail or Pass
It always takes Momentum to break Momentum!
"A small loss is just as satisfying as a large gain" -MO
"Sometimes we need to stop learning and start thinking...."
"Once you stack, you'll never go back!"
"A small loss is just as satisfying as a large gain" -MO
"Sometimes we need to stop learning and start thinking...."
"Once you stack, you'll never go back!"
-
dojirock
- rank: 1000+ posts
- Posts: 1921
- Joined: Tue Nov 17, 2009 10:11 pm
- Reputation: 726
- Gender:
- Contact:
Nice post,
Please input as long as its price action. I remember when I discovered or understood what all the guru's meant when they said that it takes force, momentum to move away from a zline(area) and also to break thru a previous area. It seems so simple yet its so easy not to see it clearly and understand that's the key in conjunction to zlines. When it happens, price comes back to suck all the noobs into a trade. By that time the big boys are already buying as price moves down and as soon as the sellers run out price takes off.
Please input as long as its price action. I remember when I discovered or understood what all the guru's meant when they said that it takes force, momentum to move away from a zline(area) and also to break thru a previous area. It seems so simple yet its so easy not to see it clearly and understand that's the key in conjunction to zlines. When it happens, price comes back to suck all the noobs into a trade. By that time the big boys are already buying as price moves down and as soon as the sellers run out price takes off.
pariah wrote:Hi Legend,
Not to usurp Doji's thread and its contents, however; I look for 'momentum' candles.
'Momentum' aka larger candles - relative to the other candles in an area indicate 2 things:
1. Crossing of a S/R line - becoming new S or R
And
2. Stopping at S/R line.
Its very strange how S/R levels correlate with 'momo' candles. Often you will find 'momo' at the beginning of S/R.
** Currently, as I'm spending upwards of 10 hours a day looking at some kind of candlestick chart - my mind is able, I believe, to identify clusters of supply and demand areas automatically. S D areas appear at key S/R lines.
From there, I just look for 'momo' away from that line/cluster - and trade in that direction.
Hope this helps.
It always takes Momentum to break Momentum!
"A small loss is just as satisfying as a large gain" -MO
"Sometimes we need to stop learning and start thinking...."
"Once you stack, you'll never go back!"
"A small loss is just as satisfying as a large gain" -MO
"Sometimes we need to stop learning and start thinking...."
"Once you stack, you'll never go back!"
-
dojirock
- rank: 1000+ posts
- Posts: 1921
- Joined: Tue Nov 17, 2009 10:11 pm
- Reputation: 726
- Gender:
- Contact:
Hi News,
Your right, the sema's have nothing to do with this exercise. See how easily they can take the focus off price action?
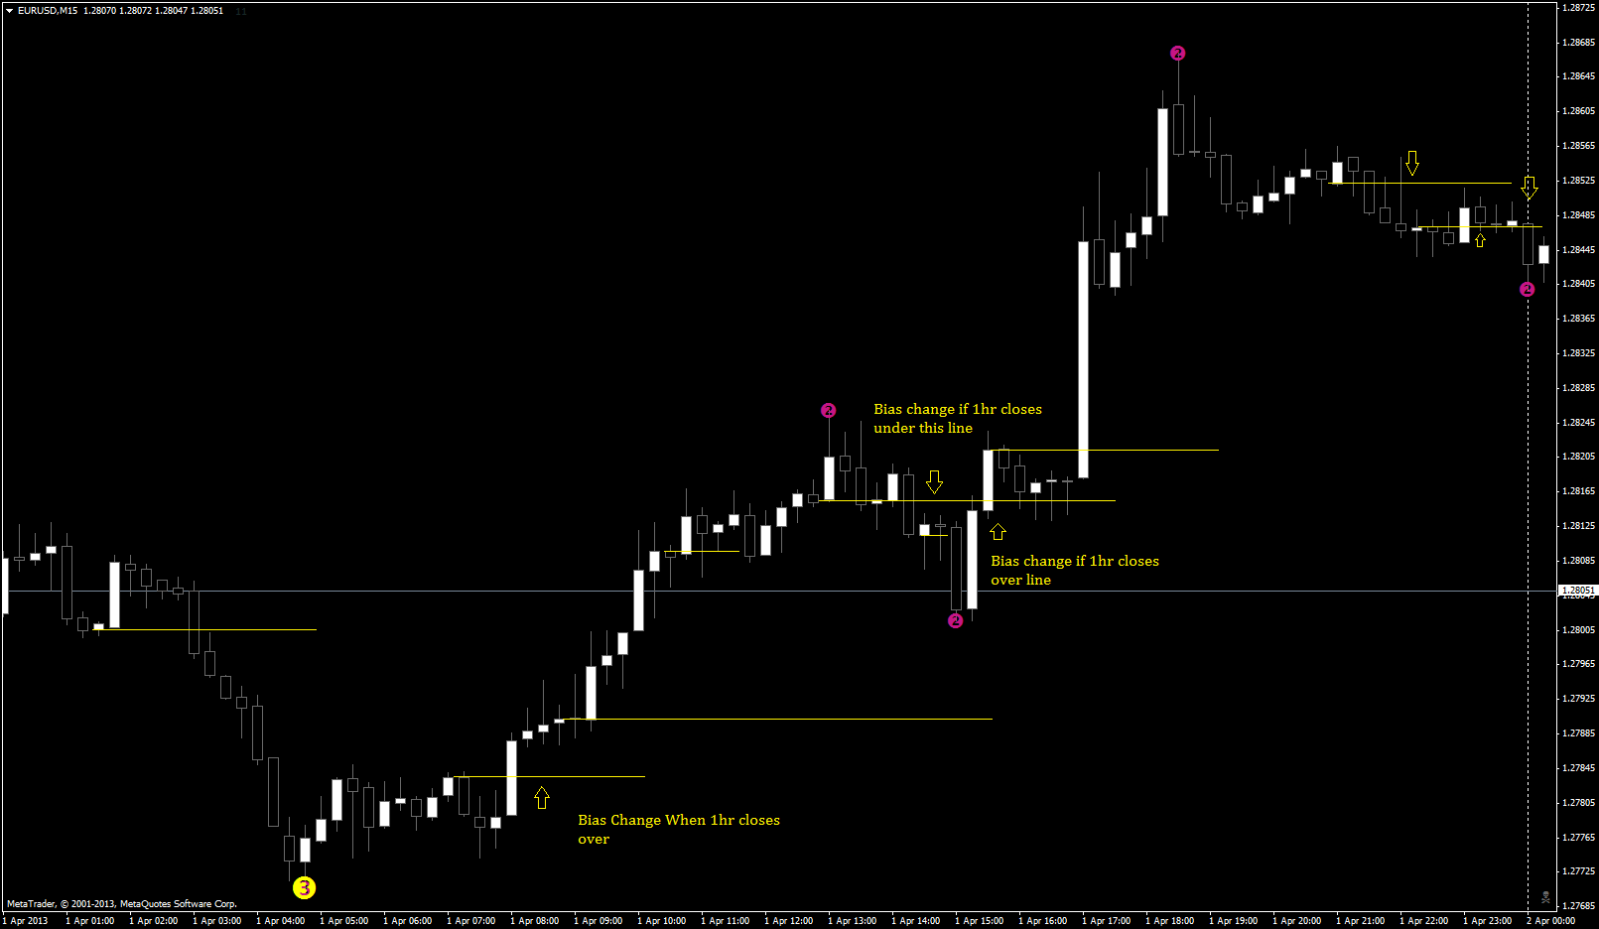
Like I said, there is now right or wrong answer, but this is the bias time frame and bias would not change unless there was a "close over" on the next time frame up. You are correct in saying I would use the 5 min as the entry time frame.
Im at a bit of a loss...on your lines. I cant define why you draw your lines per a criteria that seems to fit all the time. They seem like to me you may have random or various ways of drawing them.
Now does this mean they are wrong?...no, not if you can trade them.
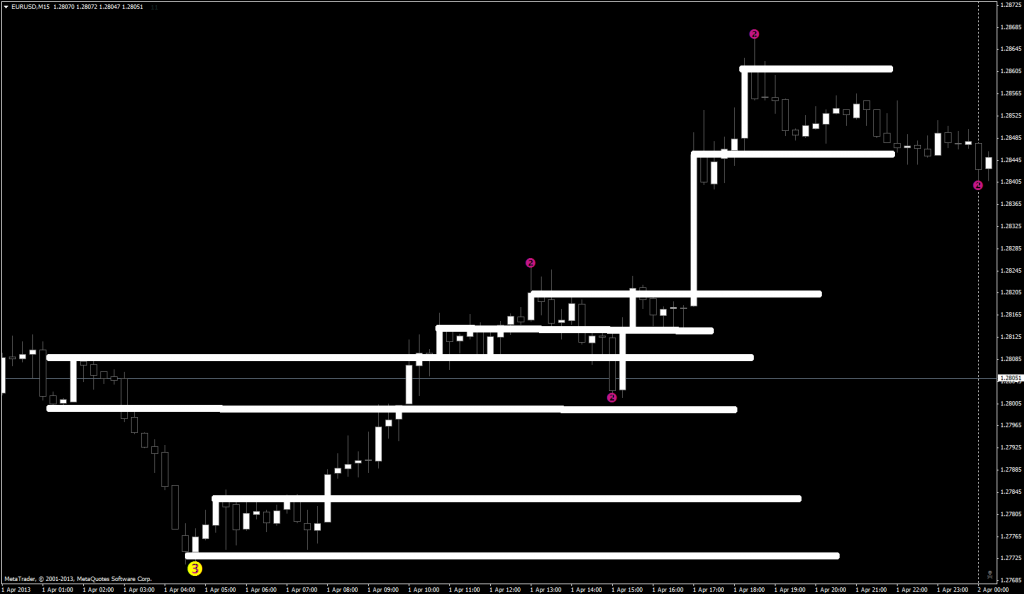
I use two colors just to avoid confusion while trying to explain how I see what I see, and also if I were to turn off the candles, I could with good certainty still trade based on my colored lines.
Your right, the sema's have nothing to do with this exercise. See how easily they can take the focus off price action?
Like I said, there is now right or wrong answer, but this is the bias time frame and bias would not change unless there was a "close over" on the next time frame up. You are correct in saying I would use the 5 min as the entry time frame.
Im at a bit of a loss...on your lines. I cant define why you draw your lines per a criteria that seems to fit all the time. They seem like to me you may have random or various ways of drawing them.
Now does this mean they are wrong?...no, not if you can trade them.
I use two colors just to avoid confusion while trying to explain how I see what I see, and also if I were to turn off the candles, I could with good certainty still trade based on my colored lines.
newscalper wrote:I'll bite
I wasn't considering if'/when the bars broke as another poster has, I've drawn the lines as they would have been. I assume these are lines to trade on the M5 as it's usual to trade lines from a higher TF tha nthe one you're looking at otherwise you won't get the range/r:r/whatever. If the answer is to be the only ones of interest are where the semas are...consider the semas were not where they are now at point of drawing the line.
It always takes Momentum to break Momentum!
"A small loss is just as satisfying as a large gain" -MO
"Sometimes we need to stop learning and start thinking...."
"Once you stack, you'll never go back!"
"A small loss is just as satisfying as a large gain" -MO
"Sometimes we need to stop learning and start thinking...."
"Once you stack, you'll never go back!"
Please add www.kreslik.com to your ad blocker white list.
Thank you for your support.
Thank you for your support.