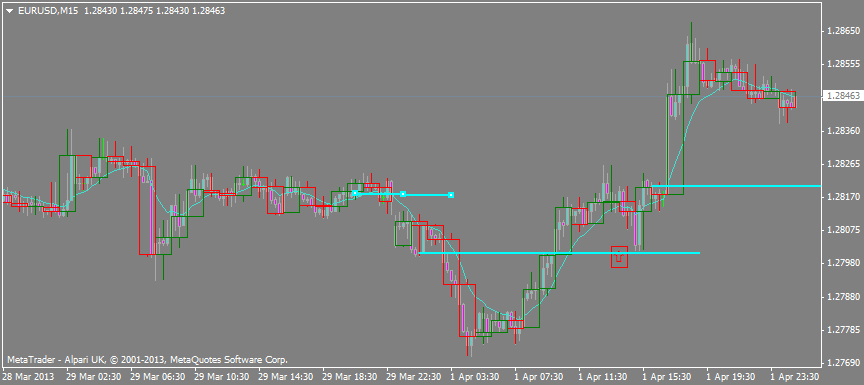
Again, these green lines are the only zlines...not selective zlines. as per how define them. How many happen to be momo breakouts by the 2x size rule? On a 15 min chart, probably all of them but I drew these off a 5 min chart to show I don't use that 2x rule in my lines.
I use momentum. What might need to be refined is your zline terminology or what momentum actually is or looks like.
A fresh start! Doji's Trading Journal
Moderator: moderators
Please add www.kreslik.com to your ad blocker white list.
Thank you for your support.
Thank you for your support.


-
newscalper

- rank: 1000+ posts

- Posts: 1068
- Joined: Tue Oct 19, 2010 5:58 pm
- Reputation: 7
- Gender:

-
dojirock

- rank: 1000+ posts
- Posts: 1921
- Joined: Tue Nov 17, 2009 10:11 pm
- Reputation: 726
- Gender:

- Contact:
update...still short...no reason to long...none at all...yet.
- Attachments
-
- usdjpym15.png (52.92 KiB) Viewed 2851 times
It always takes Momentum to break Momentum!
"A small loss is just as satisfying as a large gain" -MO
"Sometimes we need to stop learning and start thinking...."
"Once you stack, you'll never go back!"
"A small loss is just as satisfying as a large gain" -MO
"Sometimes we need to stop learning and start thinking...."
"Once you stack, you'll never go back!"
-
dojirock
- rank: 1000+ posts
- Posts: 1921
- Joined: Tue Nov 17, 2009 10:11 pm
- Reputation: 726
- Gender:
- Contact:
Hi mo,
Ok do say...
I see the 1 ema.....I see the 1/3 marks form highs to lows per candle..
Can you list the remaining steps, for your lines?
Thanks!
Ok do say...
I see the 1 ema.....I see the 1/3 marks form highs to lows per candle..
Can you list the remaining steps, for your lines?
Thanks!
It always takes Momentum to break Momentum!
"A small loss is just as satisfying as a large gain" -MO
"Sometimes we need to stop learning and start thinking...."
"Once you stack, you'll never go back!"
"A small loss is just as satisfying as a large gain" -MO
"Sometimes we need to stop learning and start thinking...."
"Once you stack, you'll never go back!"
Please add www.kreslik.com to your ad blocker white list.
Thank you for your support.
Thank you for your support.


Hi folks, I just wanted to share some very novice advice - but the method seems to be working well for me.
In the last few days I've become indicator free. Less a candle stick chart and one or 2 horizontal lines.
Indicators get in the way, because candles tell you where or not where price is going
IMO Fundamentally all you need to determine PA are 2 things.
1. an area (usually taken off m30 or h1 chart) where s become r or r becomes s - this is aka Supply or Demand, zline, support or resistance.
2. and a single m30 or h1 candle closing above or below that line to show you direction - this is Bias or Momentum, or momo etc...
3. Perhaps a third, which is another support or resistance, or supply or demand level for tp considerations.
That's it.
I just took this AJ trade, I'm up about 130 pips collectively in the last 24 hours - literally trading everything where price crosses or closes above my lines.
zakk
- Attachments
-
- 1.png (32.1 KiB) Viewed 2834 times
Please add www.kreslik.com to your ad blocker white list.
Thank you for your support.
Thank you for your support.