A fresh start! Doji's Trading Journal

If you don't know where to start, start here! Don't be afraid to ask questions.

Moderator: moderators

User avatar
newscalper
rank: 1000+ posts
rank: 1000+ posts
Posts: 1068
Joined: Tue Oct 19, 2010 5:58 pm
Reputation: 7
Gender: Female

Postby newscalper » Sat Mar 30, 2013 10:57 am

That's better defined, also exactly what I did in my chart so not sure why the eww :lol:

But the effort is very much appreciated :D

Hopefully others can see what you've posted too.

Woaah, there. Rewind. right back to the M30 chart. Why just those z-lines and not the others I can clearly see, if you're defining a z-line in the traditional sense of 'body approx 2 times or more that of previous candle'. I see way more, also one that the H1 closed down over on the run up.

Point 2, you say you've drawn the line on M30, you then see H1 close over 30 one way, and then close over it again in the opposite direction. Is this correct interpretation? Because that's what is writ? can the H1 closing in one direction include the M30 from which you drew your line (which can be the 2nd M30 period on the hour) or are you looking at the next hour? With that interpretation there is still a line in the middle of that run up with an hourly close above, close below (right where the gap occurs).

My line was on H1, I waited for an H4 to close then entered on 15, exactly what you said: using a factor of 4 each way...

The only difference was where the lines actually were (which was not defined so if price was moving down I used the last open of the bar closing down) and the entries (which was not defined so I went with a rat on pullback with a high breakout) and the exits (still not defined so I took exits at a bar closing against).

Between timeframes - I think you said 3 to 4x between frames. you're using 15, 30 and H1, that's only a factor of 2 between each one, not 4 :D which is important. But then you're also dropping one timeframe further to the m5 which you said nothing about at all.

See, people say forum learning is bad etc and that folks interpret things incorrectly but that's because they are presented with incomplete information to begin with.

OK. Your entries. Let's see if I've understood this.
1st entry on the hourly close across the line.
2nd entry when price pulls back across the EMA on M15 the...not sure why you're dropping to 5.

Exits: still no idea

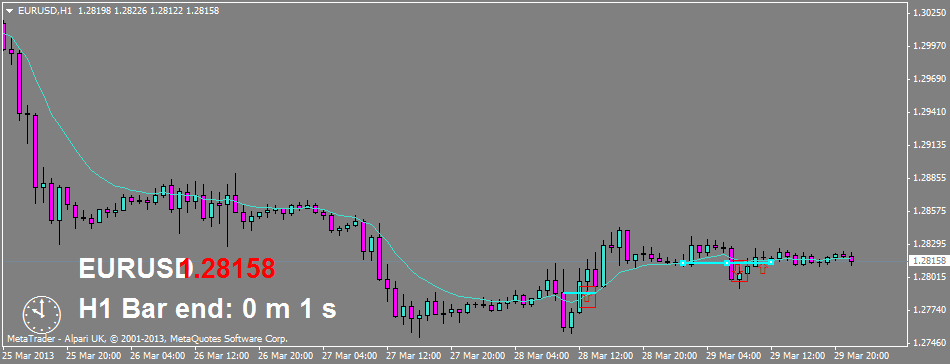
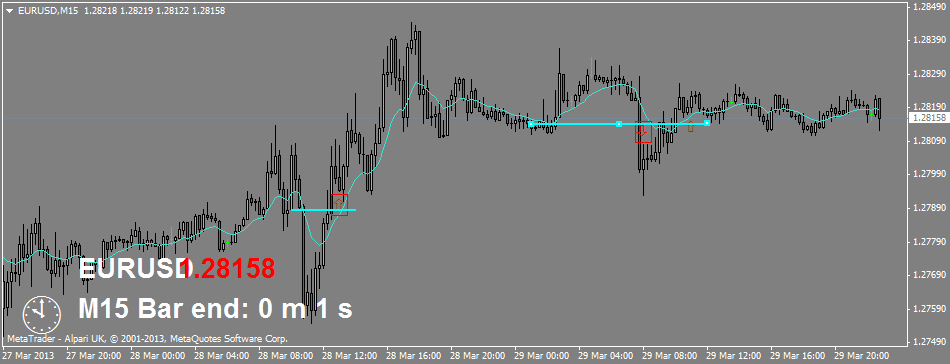
This is a trending market from days ago. Nice to see this on the sideways market of 27th/28th...

post to follow with pics

Please do'nt think I'm having any kind of a 'go' here btw as I'm not, this long post is just clearing some things up.

Please add www.kreslik.com to your ad blocker white list.
Thank you for your support.

User avatar
newscalper
rank: 1000+ posts
rank: 1000+ posts
Posts: 1068
Joined: Tue Oct 19, 2010 5:58 pm
Reputation: 7
Gender: Female

Postby newscalper » Sat Mar 30, 2013 11:18 am

OK

M30 Chart, lines
Image

Wait for line to fail with H1 close
Image
Then down on M15, pullback entries etc
Image

As can see later it goes dead dead dead but this IS a bank holiday Friday.

User avatar
MightyOne
rank: 5000+ posts
rank: 5000+ posts
Posts: 6055
Joined: Wed Dec 10, 2008 6:33 pm
Reputation: 560
Gender: Male

Postby MightyOne » Sat Mar 30, 2013 6:40 pm

... if you're defining a z-line in the traditional sense of 'body approx 2 times or more that of previous candle'... -newscalper

That is not 'traditional', 2x the prev. is a cop out for doing comparisons.

In order to use a candle chart, you are going to have to develop detective skills:

THIS IS YOUR CHART that i marked.:
Image

dojirock can attempt to teach similar things, as marked, to you but it really takes an open mind and years of watching price action.

To make up for being a novice, consider the line chart first and then interpret the candle chart while at the same time disregarding conflicting analysis.

Position: large time frame extremes & movement of stops
Space: Sizing your trades & manipulating positions
Horizontal Lines: 'Bias' using a line chart
Small charts: Working from the bottom while trading the big picture.

Then add candlestick analysis (interpreting body size & combinations)

User avatar
dojirock
rank: 1000+ posts
rank: 1000+ posts
Posts: 1921
Joined: Tue Nov 17, 2009 10:11 pm
Reputation: 726
Gender: None specified
Contact:

Postby dojirock » Sun Mar 31, 2013 4:48 am

Duplicate post....
Last edited by dojirock on Sun Mar 31, 2013 5:01 am, edited 1 time in total.
It always takes Momentum to break Momentum!
"A small loss is just as satisfying as a large gain" -MO
"Sometimes we need to stop learning and start thinking...."
"Once you stack, you'll never go back!"

User avatar
dojirock
rank: 1000+ posts
rank: 1000+ posts
Posts: 1921
Joined: Tue Nov 17, 2009 10:11 pm
Reputation: 726
Gender: None specified
Contact:

Postby dojirock » Sun Mar 31, 2013 4:59 am

Why just those z-lines and not the others I can clearly see, if you're defining a z-line in the traditional sense of 'body approx 2 times or more that of previous candle'. I see way more, also one that the H1 closed down over on the run up.

What you can clearly see is an illusion, and coincidence.
Look deeper.


This is not how I determine my zlines.........ugh..
alot of my zlines are 2x candles, it takes momentum to move away from a zline and it takes momentum to break a zline. Remember the zline im trading is from the past...history trading...as I have always said in my thread.

There is a pic from MO, I think in 2009. I will look for it...it says it all.....
I remember looking at it for hours and thinking it was screwed up. But turns out it was spot on. I know I saved it because it was one of the big gold nuggets for me. I will check my archive tomorrow.
It always takes Momentum to break Momentum!
"A small loss is just as satisfying as a large gain" -MO
"Sometimes we need to stop learning and start thinking...."
"Once you stack, you'll never go back!"

Please add www.kreslik.com to your ad blocker white list.
Thank you for your support.

User avatar
dojirock
rank: 1000+ posts
rank: 1000+ posts
Posts: 1921
Joined: Tue Nov 17, 2009 10:11 pm
Reputation: 726
Gender: None specified
Contact:

Postby dojirock » Sun Mar 31, 2013 5:11 am

Im not sure where the "traditional sense" of 2x the previous had to be momentum or a zline. Its a way of finding some, but it doesnt define them. I know that messed me up for months.

Its pure s/d.... it takes momentum to break it and momentum leaves it. Its at that point I draw my zlines. Call them to be in a neutral state until they are violated by momentum. Thats when and how I trade them.
It always takes Momentum to break Momentum!
"A small loss is just as satisfying as a large gain" -MO
"Sometimes we need to stop learning and start thinking...."
"Once you stack, you'll never go back!"

Dan
rank: 50+ posts
rank: 50+ posts
Posts: 93
Joined: Thu Jul 05, 2012 9:45 am
Reputation: 26
Location: Sydney
Gender: Male

Postby Dan » Sun Mar 31, 2013 6:45 am

.
Last edited by Dan on Sun Aug 15, 2021 8:44 am, edited 1 time in total.

Dan
rank: 50+ posts
rank: 50+ posts
Posts: 93
Joined: Thu Jul 05, 2012 9:45 am
Reputation: 26
Location: Sydney
Gender: Male

Postby Dan » Sun Mar 31, 2013 11:18 am

.
Last edited by Dan on Sun Aug 15, 2021 8:44 am, edited 1 time in total.

User avatar
dojirock
rank: 1000+ posts
rank: 1000+ posts
Posts: 1921
Joined: Tue Nov 17, 2009 10:11 pm
Reputation: 726
Gender: None specified
Contact:

Postby dojirock » Mon Apr 01, 2013 4:39 am

Since the vertical line, these are the only 3 zlines that matter to me.
They are the only ones that tell me im short bias. I will not be long bias until price on the 15 min closes above one of them.

Nice work Dan. Everyone learns to see price in there own way. I'm not even going to draw my lines on your charts...they are there but in different places. i trade exactly like dragon, but a little more conservative.

Dan please keep posting...you may provide the link for News.
It only takes things being said just the right way for someone to have there big ahh haa moment.
Attachments
usdjpym5.png
usdjpym5.png (46.28 KiB) Viewed 2826 times
It always takes Momentum to break Momentum!
"A small loss is just as satisfying as a large gain" -MO
"Sometimes we need to stop learning and start thinking...."
"Once you stack, you'll never go back!"

User avatar
dojirock
rank: 1000+ posts
rank: 1000+ posts
Posts: 1921
Joined: Tue Nov 17, 2009 10:11 pm
Reputation: 726
Gender: None specified
Contact:

Postby dojirock » Mon Apr 01, 2013 10:51 am

Update this morning....
Attachments
usdjpym5.png
usdjpym5.png (39.65 KiB) Viewed 2797 times
It always takes Momentum to break Momentum!
"A small loss is just as satisfying as a large gain" -MO
"Sometimes we need to stop learning and start thinking...."
"Once you stack, you'll never go back!"

Please add www.kreslik.com to your ad blocker white list.
Thank you for your support.


Return to “beginners forum”