dojirock wrote:I have used sema's, up til now completely wrong....they are just markers in a sense of support and demand on a given time frame?
Just like TRO has an indicator TRO_PLOT that marks the high and low of the H4/D1/W1/MN1; Semas mark the high/low of a rolling period of candles {the three numbers you use in the settings}
 johnsund wrote:
Tyger - the semafor is an indication of a high or low "X" number of bars back. Standard settings are: 1 = 5 bars back; 2 = 13 bars back; 3 = 34 bars back. These are changable. So, if there is a 3 at the top of the chart it means that the price at the top of the bar/wick where the 3 is present is the highest price in the past 34 bars. This is the reason the semafors "repaint" They are an indication that price has hit a high/low for a specific number of bars back and during a given candle that price is on the move and may push the 1, 2 or 3 to its new level. It is NOT an indication of a reversal or anything else that some read into it. Merely the high or low of a certain number of bars back.
dchappy wrote:I have always viewed the semafor as an " area of exhaustion " and not a single point .
Using a " lagging " trigger , gives the semafor time to " settle - down " and confirm a reversal .
( Indicators give an "indication " of something that May or May not happen )
Just my 2 cents ..

The thread is a fun read if you still want to know a thing or two about Sema's...the thread starts off with some idiot spoutin' off some half-a$$ observations, and then later, more knowledgeable traders come in to set him straight.
Plus, you will no longer be among the ranks of the retards that cry about how it "repaints".
dojirock wrote:As i started drawing lines by hand, I notice that previous semas, when broken, are broken by mbars. This means to me it takes momentum to break a previous support or demand level?
If this indeed correct...then as it approaches a level...if momentum slows, look for a reversal. If it flies through then that previous support becomes resistance if price is going short and resistance becomes the new support if price is moving long? That break in the old support or resistance is done by an mbar which is around the 50% level....thus when it is valid price returns to that level then reverses which would be our entry point?
Am I even close....man I hope so...
Looks like you and I both are busting our heads trying to figure out how to handle a failed S&R trade; and how to spot a failed vs successful S&R trade from a mile away. Just keep in mind that even the best of observations and note-taking will yield no holy-grail for those situations, ANYTHING CAN
STILL HAPPEN!!
dojirock wrote:Logically it makes sense to my trading method of why I am almost always on the wrong side of the trade, it goes against me(the break out of support or demand) and then returns 50% to the mbar (which puts me close to break even) then takes off against me badly...that is why I have leaned to exit with a small loss in those scenarios.

One of my all-time favorite MightyOne post's if I do say so myself...
_____ _____
Posted: Tue Dec 23, 2008 MightyOne wrote:You cry your self to sleep saying,"man! I get stopped out and the trade eventually goes in the direction I was hoping to trade."
Do you think that you are the only one this is happening to?
Can you see how your words of defeat can be your words of victory if only you would utilize your observation?
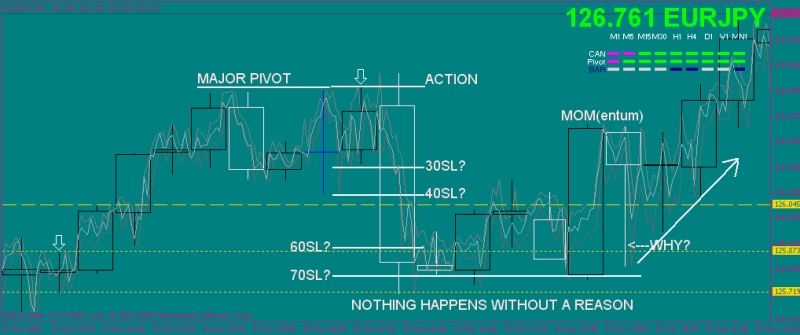
The magnitude of the correction is ~equal to the time frame on which the breakout can be seen.
The larger the pivot the more long term traders are sitting with MASSIVE STOPS.
What is true for you on your time frame is true for a trader of a larger time frame.
Now that you understand that profit is being eliminated in ALL time frames you can piece together what is happening based on the reaction
and what action price will take based on your observation ie
"man! I get stopped out and the trade
eventually goes in the direction I was hoping to trade."
I get stopped out (reaction)
It eventually goes in the direction I was hoping to trade (action)
http://kreslik.com/forums/userpix/6662_zero012_1.jpg
dojirock wrote:So the big question in my head...is how do I recognize the right side of the trade....this is where I am .
The following is part of your answer...
es/pip wrote:brettnchrism wrote:Ok I am waiting for my ah ha moment here. My first one was seeing how traders get zero'd out and I completely see that all over my charts with the help of blubb's z line indicator.
Now ES said (if this trade/area holds where is the next group of traders sitting with held profits) Ok I see on the charts I posted that GJ just zero'd out profit holders in the 35 area and now made a new momo up on the hourly along with making a double bottom. Price is headed for the 25 zl which is a H4 H1 target. [highlight=violet]This is where I loose it. How can I tell if after the 25 zl gets hit that price will not continue up to the short holders or going to stop at the 25 area and continue down to the long holders.[/highlight] I did look at the H4 and there is a momo down bar so what I would say since we have a hourly momo up into a down h4 momo a long would not be advised. Anyway this is the last part of my puzzle how to determine directon after a zl has beeen hit. I posted GJ chart H4 and H1 for an example.
[highlight=violet]"This is where I loose it. How can I tell if after the 25 zl gets hit that price will not continue up to the short holders or going to stop at the 25 area and continue down to the long holders. "[/highlight]
[highlight=yellow]i don't know--- you cant know--- no one knows (except maybe MO)-----. if someone figures that out please let me know.[/highlight] All i know is the market lives to zero out other traders, it moves to and from each area and sometimes the area holds and sometimes it does not.
you have to think about what all the other traders did and are thinking about doing. and then trade off of their emotions. it is all about held profit and momentum.
so (keep in mind this is friday afternoon)
this what i would be looking at and thinking-- i don't trade this pair but this is what i would think when i look at this chart
in your 4 hr chart example if i saw the double bottom and notice the momo slowing into it.
so if i was thinking of trading long i would dial down and look for a reason to trade long
if i was only referencing the h4 as far as held profit i would be targeting the magenta line. when price gets up there i would take my profit and then look inside and see whats happening to see if i am going to try and trade short back down to the yellow line.
if the PA and momo do not show that the magneta line is going to hold the price and we have momo up thru that area. Then i would be looking to get back in long( based on momo) and trade up to the next area of held profit--- which would be the red line.
I am not sure i can explain what i do---- hell i am not sure i even know what i am doing when i am doing it---------- i just look at where we are where we came from and where we are going next---based on held profit------- and then trade to and from those areas based on momo.
momo shows the way
held profit is the destination
dojirock wrote:It may seem stupid but I now know what they mean by support and resistance being dynamic......when using those indicators...
http://kreslik.com/forums/viewtopic.php?p=37519#37519http://kreslik.com/forums/viewtopic.php?p=38035#38035http://kreslik.com/forums/viewtopic.php?p=37620#37620http://kreslik.com/forums/viewtopic.php?p=38169#38169dojirock wrote:Look forward to your input... Im on demo until i get this worked out..hehe
Doji
Looks like you and I are heading about the same way right about now. Hope you don't mind the overly-linked and quote-boxed reply. 

I'm actually about to quote-box & link a few things in my thread as well.
Plus, I can't wait to get back to my trading next week, enough of this reading old threads crap already!!
(Which reminds me, I have a special post for MO coming up...he has a little grudge against my posting style it seems 
 )
)


